Nội dung toàn văn Decision No. 529/QD-LDTBXH 2014 approving result survey revision poor near poor household 2013
|
MINISTRY OF LABOUR – INVALIDS AND SOCIAL AFFAIRS |
SOCIALIST REPUBLIC OF VIETNAM |
|
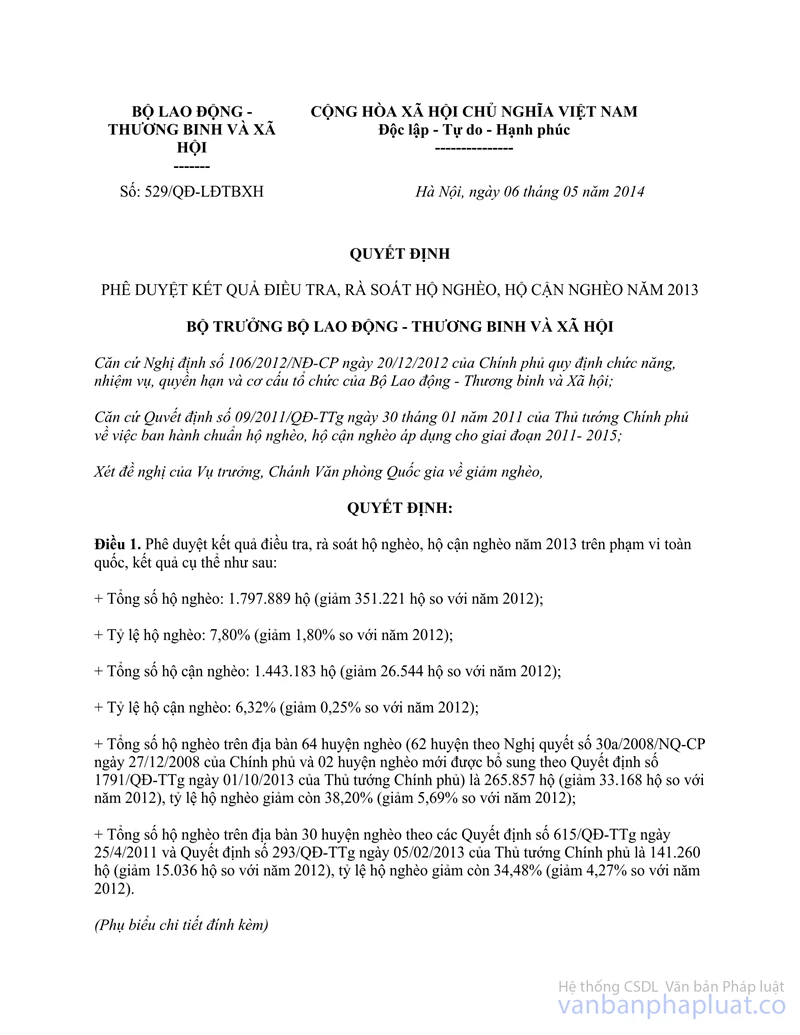
No: 529/QD-LDTBXH |
Hanoi, May 06th, 2014 |
DECISION
ON APPROVING THE RESULT OF SURVEY, REVISION ON POOR HOUSEHOLD AND NEAR POOR HOUSEHOLD IN 2013
MINISTER OF LABOUR – INVALIDS AND SOCIAL AFFAIRS
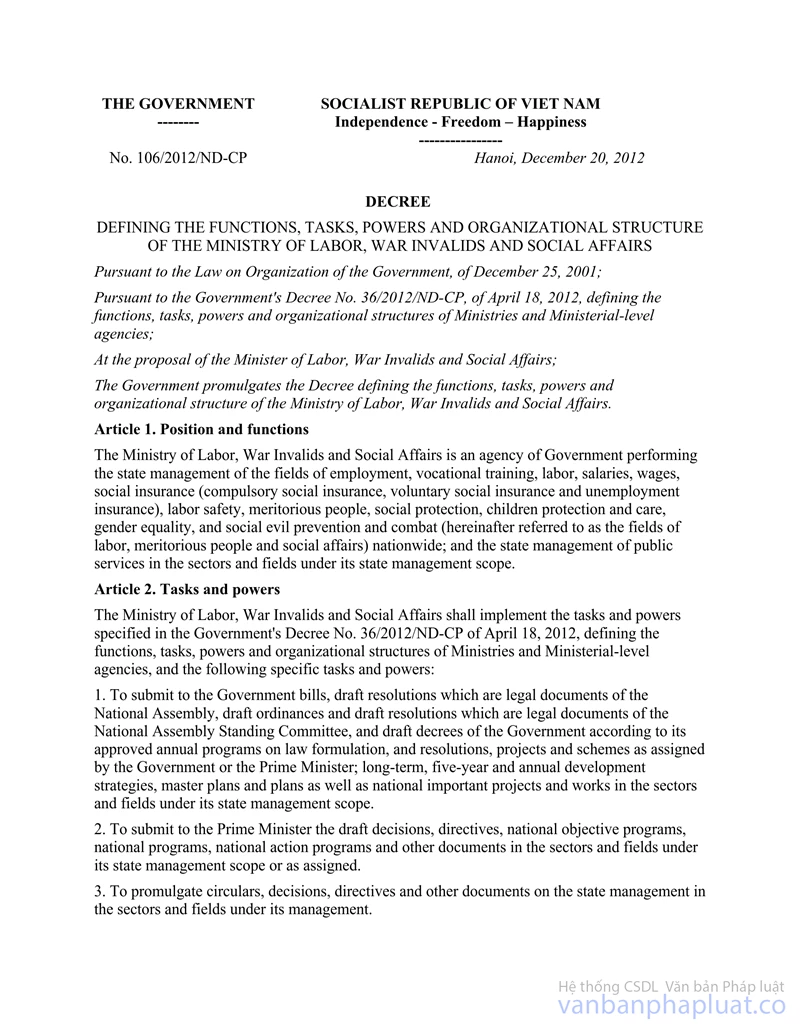
Pursuant to the Decree No.106/2012/ND-CP dated on December 20th, 2012 by the Government on stipulating functions, responsibilities, authorities and organization structure of the Ministry of Labour – Invalids and Social Affairs;
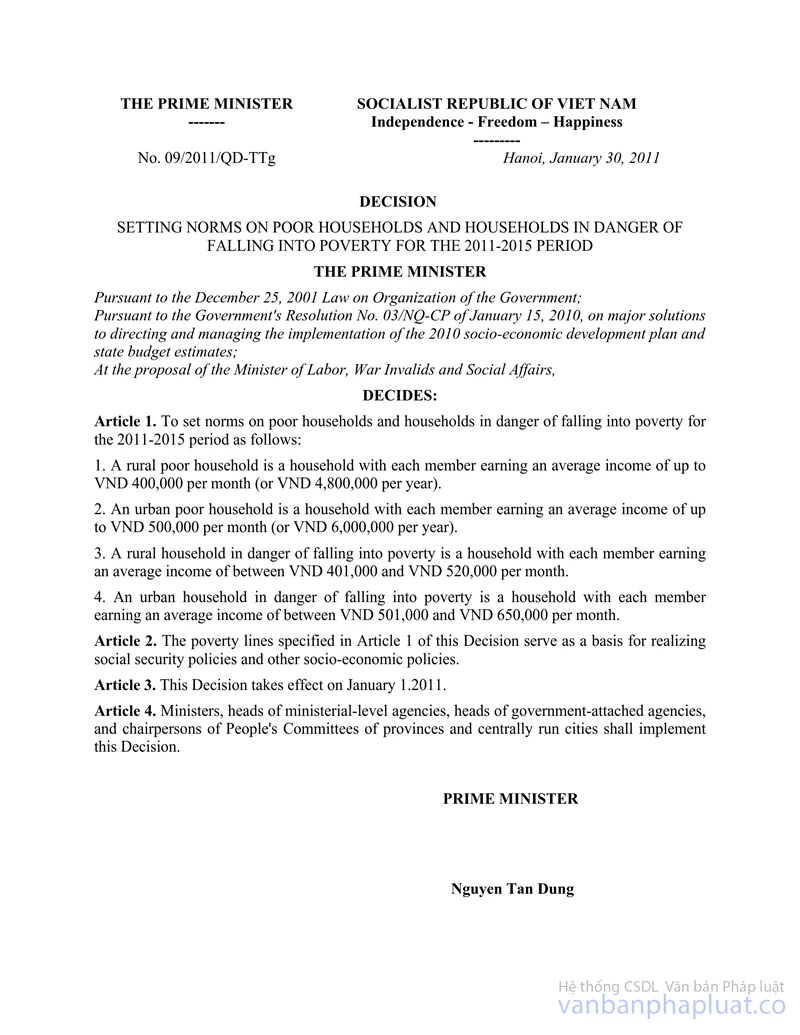
Pursuant to the Decree No. 09/2011/QD-TTg dated on January 30th, 2011 by Prime Minister on issuing the standard of poor household and near poor household applied for the period of 2011-2015;
On the requests of the Director General, Chief of the National Office for Poverty Reduction,
DECIDE:
Article 1. Approving the result of the survey, revision on poor household and near poor household in 2013 with the scale of on the whole country, the detail result as follow:
+ Total number of poor households: 1,797,889 households (reducing by 351,221 household compared with 2012);
+ Rate of poor households: 7.80% (reducing by 1.80% compared with 2012);
+ Total number of near poor households: 1,443,183 households (reducing by 26,544 households compared with 2012);
+ Rate of near poor households: 6.32% (reducing by 0.25% compared with 2012);
+ Total number of poor households in the areas of 64 poor rural districts (62 rural districts in accordance with Resolution No.30a/2008/NQ-CP dated on December 27th, 2008 by the Government and 02 poor rural districts supplemented in accordance with the Decision No.1791/QD-TTg dated October 01st, 2013 by the Prime Minister) are 265,857 households (reducing 33,168 households compared with 2012), Rate of poor households reduces to 38.20% (reducing by 5.69% compared with 2012);
+ Total number of poor households on the areas of 30 poor rural districts in accordance with Decision No. 615/QD-TTg dated April 25th, 2011 and Decision No. 293/QD-TTg dated February 05th, 2013 by Prime Minister are 141,260 households (reducing by 15,036 households compared with 2012), the rate of poor households reduce to 34.48% (reducing by 4.27% compared with 2012).
(Detail appendix enclosed)
Article 2. The number of poor households, near poor households approved in this Decision would be the base to implement the social security policies and other socio-economic policies in 2014.
Article 3. The Ministers, Head of the Ministerial Agencies, Head of the Governmental Agencies, President of the People’s Committee of Province/central affiliated cities are responsible for implementing this Decision./.
|
|
THE MINISTER |
RESULT OF THE SURVEY, REVISION OF POOR HOUSEHOLDS, NEAR POOR HOUSEHOLDS IN 2013
(Promulgated together with the Decision No.529/QD-BLDTBXH dated May 06th, 2014 by the Ministry of Labour - Invalids and Social Affairs)
|
No. |
Province/city |
Poor household |
Near poor household |
||
|
Quality |
Rate (%) |
Quality |
Rate (%) |
||
|
ON THE WHOLE COUNTRY |
1,797,889 |
7.80 |
1,443,183 |
6.32 |
|
|
I. Northeast mountainous area |
372,223 |
14.81 |
244,506 |
9.73 |
|
|
1 |
Ha Giang |
43,871 |
26.95 |
23,039 |
14.15 |
|
2 |
Tuyen Quang |
34,835 |
17.93 |
28,838 |
14.84 |
|
3 |
Cao Bang |
29,122 |
24.20 |
10,567 |
8.78 |
|
4 |
Lang Son |
33,215 |
18.00 |
20,527 |
11.13 |
|
5 |
Thai Nguyen |
35,380 |
11.61 |
35,023 |
11.49 |
|
6 |
Bac Giang |
44,541 |
10.44 |
31,546 |
7.39 |
|
7 |
Lao Cai |
33,022 |
22.21 |
18,842 |
12.67 |
|
8 |
Yen Bai |
49,530 |
25.38 |
15,961 |
8.18 |
|
9 |
Phu Tho |
46,916 |
12.52 |
43,779 |
11.68 |
|
10 |
Quang Ninh |
7,887 |
2.42 |
7,992 |
2.46 |
|
11 |
Bac Kan |
13,904 |
18.55 |
8,392 |
11.20 |
|
II. Northwest mountainous area |
169,128 |
25.86 |
84,488 |
12.92 |
|
|
12 |
Son La |
68,947 |
27.01 |
30,277 |
11.86 |
|
13 |
Dien Bien |
39,426 |
35.22 |
10,313 |
9.21 |
|
14 |
Lai Chau |
22,712 |
27.22 |
7,270 |
8.71 |
|
15 |
Hoa Binh |
38,043 |
18.70 |
36,628 |
18.01 |
|
III. Red River Delta |
195,372 |
3.63 |
209,294 |
3.89 |
|
|
16 |
Bac Ninh |
9,953 |
3.42 |
10,478 |
3.61 |
|
17 |
Vinh Phuc |
13,696 |
4.93 |
12,717 |
4.57 |
|
18 |
Hanoi |
17,373 |
1.01 |
43,718 |
2.55 |
|
19 |
Hai Phong |
16,686 |
3.23 |
18,755 |
3.63 |
|
20 |
Nam Dinh |
31,063 |
5.33 |
33,661 |
5.78 |
|
21 |
Ha Nam |
16,457 |
6.28 |
14,079 |
5.37 |
|
22 |
Hai Duong |
30,955 |
5.82 |
25,756 |
4.84 |
|
23 |
Hung Yen |
17,043 |
5.10 |
13,282 |
3.97 |
|
24 |
Thai Binh |
27,091 |
4.55 |
20,951 |
3.51 |
|
25 |
Ninh Binh |
15,055 |
5.44 |
15,897 |
5.74 |
|
IV. North Central Coast |
331,697 |
12.22 |
327,372 |
12.06 |
|
|
26 |
Thanh Hoa |
121,849 |
13.13 |
102,007 |
10.99 |
|
27 |
Nghe An |
102,723 |
13.42 |
99,432 |
12.99 |
|
28 |
Ha Tinh |
39,105 |
10.69 |
50,586 |
13.83 |
|
29 |
Quang Binh |
31,796 |
14.18 |
40,848 |
18.22 |
|
30 |
Quang Tri |
18,982 |
11.77 |
17,393 |
10.78 |
|
31 |
Thua Thien Hue |
17,242 |
6.42 |
17,106 |
6.37 |
|
V. Central Coast |
206,808 |
10.15 |
174,800 |
8.58 |
|
|
32 |
Da Nang City |
1,873 |
0.77 |
6,621 |
2.73 |
|
33 |
Quang Nam |
58,269 |
14.91 |
44,047 |
11.27 |
|
34 |
Quang Ngai |
49,616 |
14.93 |
32,220 |
9.70 |
|
35 |
Binh Dinh |
39,686 |
9.85 |
21,864 |
5.43 |
|
36 |
Phu Yen |
31,415 |
13.03 |
28,635 |
11.88 |
|
37 |
Khanh Hoa |
11,790 |
4,26 |
28.523 |
10.32 |
|
38 |
Ninh Thuan |
14,159 |
9.34 |
12,890 |
8.50 |
|
VI. Central Highland |
158,486 |
12.56 |
87,500 |
6.93 |
|
|
39 |
Gia Lai |
53,389 |
17.23 |
23,776 |
7.67 |
|
40 |
Dak Lak |
50,334 |
12.26 |
32,168 |
7.83 |
|
41 |
Dak Nong |
20,715 |
15.64 |
10,674 |
8.06 |
|
42 |
Kon Tum |
21,848 |
19.20 |
7,510 |
6.60 |
|
43 |
Lam Dong |
12,200 |
4.13 |
13,372 |
4.52 |
|
VII. Southeast |
36,554 |
0.95 |
40,432 |
1.05 |
|
|
44 |
Ho Chi Minh City |
0 |
0.00 |
5,777 |
0.04 |
|
45 |
Binh Thuan |
14,145 |
4.88 |
9,922 |
3.91 |
|
46 |
Tay Ninh |
4,749 |
1.67 |
6,647 |
1.50 |
|
47 |
Binh Phuoc |
10,624 |
4.50 |
8,169 |
3.32 |
|
48 |
Binh Duong |
0 |
0.00 |
0 |
0.00 |
|
49 |
Dong Nai |
4,780 |
0.66 |
6,307 |
0.43 |
|
50 |
Ba Ria - Vung Tau |
2,256 |
0.95 |
3,610 |
0.94 |
|
VIII. Mekong Delta |
327,621 |
7.41 |
274,791 |
6.22 |
|
|
51 |
Long An |
14,533 |
3.81 |
14,516 |
3.80 |
|
52 |
Dong Thap |
31,908 |
7.48 |
29,636 |
6.95 |
|
53 |
An Giang |
26,945 |
4.96 |
31,776 |
5.85 |
|
54 |
Tien Giang |
28,336 |
6.33 |
22,490 |
5.02 |
|
55 |
Ben Tre |
31,657 |
8.59 |
22,707 |
6.16 |
|
56 |
Vinh Long |
12,623 |
4.57 |
13,566 |
4.92 |
|
57 |
Tra Vinh |
36,841 |
13.96 |
23,471 |
8.90 |
|
58 |
Hau Giang |
22,469 |
11.58 |
16,840 |
8.68 |
|
59 |
Can Tho |
11,867 |
3.95 |
11,692 |
3.89 |
|
60 |
Soc Trang |
53,295 |
16.99 |
43,723 |
13.94 |
|
61 |
Kien Giang |
19,472 |
4.73 |
19,877 |
4.83 |
|
62 |
Bac Lieu |
18,478 |
9.39 |
12,243 |
6.22 |
|
63 |
Ca Mau |
19,197 |
6.49 |
12,254 |
4.14 |
THE POOR HOUSEHOLD RATE IN 2013 OF 64 POOR RURAL DISTRICTS IN ACCORDANCE WITH RESOLUTION NO. 30a/2008/NQ-CP OF THE GOVERNMENT
(Promulgated together with the Decision No.529/QD-BLDTBXH dated May 06th, 2014 by the Ministry of Labour - Invalids and Social Affairs)
|
No. |
Province/ City |
Poor household |
Near poor household |
||
|
Quality |
Rate (%) |
Quality |
Rate(%) |
||
|
|
Total |
265,857 |
38.20 |
104,197 |
14.97 |
|
|
Ha Giang |
31,847 |
39.52 |
13,329 |
16.54 |
|
1 |
Meo Vac |
6,661 |
45.53 |
1,831 |
12.52 |
|
2 |
Dong Van |
7,445 |
51.09 |
2,687 |
18.44 |
|
3 |
Yen Minh |
5,466 |
34.32 |
2,266 |
14.23 |
|
4 |
Quan Ba |
3,264 |
31.30 |
2,247 |
21.55 |
|
5 |
Xin Man |
4,933 |
39.77 |
2,293 |
18.49 |
|
6 |
Hoang Su Phi |
4,078 |
32.33 |
2,005 |
15.89 |
|
|
Cao Bang |
15,460 |
39.47 |
3,579 |
9.08 |
|
7 |
Ha Quang |
2,202 |
28.75 |
833 |
10.59 |
|
8 |
Bao Lam |
4,913 |
45.40 |
1,182 |
10.92 |
|
9 |
Bao Lac |
4,238 |
42.97 |
663 |
6.72 |
|
10 |
Thong Nong |
2,363 |
46.37 |
121 |
2.37 |
|
11 |
Ha Lang |
1,744 |
30.43 |
780 |
13.61 |
|
|
Bac Kan |
4,736 |
26.88 |
2,437 |
13.83 |
|
12 |
Pac Nam |
2,248 |
35.36 |
597 |
9.39 |
|
13 |
Ba Be |
2,488 |
22.10 |
1,840 |
16.34 |
|
|
Lao Cai |
11,301 |
36.42 |
5,193 |
16.74 |
|
14 |
Bac Ha |
4,364 |
34.98 |
1,623 |
13.01 |
|
15 |
Si Ma Cai |
2,325 |
36.06 |
1,143 |
17.73 |
|
16 |
Muong Khuong |
4,612 |
38.10 |
2,427 |
20.05 |
|
|
Yen Bai |
9,999 |
66.25 |
1,142 |
7.57 |
|
17 |
Tram Tau |
3,577 |
66.07 |
379 |
7.00 |
|
18 |
Mu Cang Chai |
6,422 |
66.35 |
763 |
7.88 |
|
|
Bac Giang |
6,634 |
37.01 |
2,580 |
14.39 |
|
19 |
Son Dong |
6,634 |
37.01 |
2,580 |
14.39 |
|
|
Phu Tho |
5,744 |
29.07 |
4,463 |
22.59 |
|
20 |
Tan Son |
5,744 |
29.07 |
4,463 |
22.59 |
|
|
Dien Bien |
21,627 |
52.30 |
3,317 |
8.02 |
|
21 |
Dien Bien Dong |
3,978 |
42.22 |
855 |
9.07 |
|
22 |
Muong Ang |
3,690 |
54.09 |
294 |
4.31 |
|
23 |
Muong Nhe |
5,239 |
54.88 |
939 |
9.84 |
|
24 |
Tua Chua |
4,113 |
53.50 |
738 |
9.60 |
|
25 |
Nam Po * |
4,607 |
58.52 |
491 |
6.24 |
|
|
Lai Chau |
20,177 |
31.64 |
6,439 |
10.10 |
|
26 |
Phong Tho |
4,327 |
30.58 |
2,713 |
19.18 |
|
27 |
Sin Ho |
4,998 |
34.95 |
1,606 |
11.23 |
|
28 |
Muong Te |
3,833 |
48.32 |
494 |
6.23 |
|
29 |
Tan Uyen |
2,338 |
22.16 |
648 |
6.14 |
|
30 |
Than Uyen |
2,700 |
22.09 |
789 |
6.46 |
|
31 |
Nam Nhun * |
1,981 |
42.80 |
189 |
4.08 |
|
|
Son La |
25,687 |
32.02 |
12,884 |
16.06 |
|
32 |
Muong La |
8,191 |
42.41 |
1,867 |
9.67 |
|
33 |
Quynh Nhai |
3,479 |
25.88 |
1,206 |
8.97 |
|
34 |
Phu Yen |
6,106 |
23.47 |
8,043 |
30.91 |
|
35 |
Bac Yen |
4,145 |
33.85 |
1,282 |
10.47 |
|
36 |
Sop Cop |
3,766 |
40.97 |
486 |
5.29 |
|
|
Thanh Hoa |
30,470 |
30.36 |
18,639 |
18.57 |
|
37 |
Nhu Xuan |
4,816 |
30.96 |
2,570 |
16.52 |
|
38 |
Thuong Xuan |
6,380 |
29.79 |
4,042 |
18.88 |
|
39 |
Lang Chanh |
4,067 |
36.47 |
2,222 |
19.92 |
|
40 |
Ba Thuoc |
6,099 |
23.61 |
5,617 |
21.74 |
|
41 |
Quan Hoa |
3,492 |
33.16 |
2,100 |
19.94 |
|
42 |
Quan Son |
2,648 |
31.40 |
982 |
11.64 |
|
43 |
Muong Lat |
2,968 |
39.82 |
1,106 |
14.84 |
|
|
Nghe An |
23,615 |
51.20 |
5,479 |
11.88 |
|
44 |
Que Phong |
6,092 |
41.18 |
1,819 |
12.30 |
|
45 |
Ky Son |
8,917 |
60.93 |
2,054 |
14.03 |
|
46 |
Tuong Duong |
8,606 |
51.55 |
1,606 |
9.62 |
|
|
Quang Binh |
4,372 |
36.17 |
5,807 |
48.04 |
|
47 |
Minh Hoa |
4,372 |
36.17 |
5,807 |
48.04 |
|
|
Quang Tri |
2,674 |
30.56 |
991 |
11.33 |
|
48 |
DaKrong |
2,674 |
30.56 |
991 |
11.33 |
|
|
Quang Nam |
9,817 |
60.39 |
1,780 |
10.95 |
|
49 |
Tay Giang |
2,019 |
51.98 |
244 |
6.28 |
|
50 |
Phuoc Son |
3,271 |
53.72 |
804 |
13.20 |
|
51 |
South Tra My |
4,527 |
72.05 |
732 |
11.65 |
|
|
Quang Ngai |
24,018 |
41.57 |
8,604 |
14.89 |
|
52 |
Tra Bong |
3,781 |
46.21 |
2,295 |
28.05 |
|
53 |
Son Ha |
8,205 |
40.85 |
2,412 |
12.01 |
|
54 |
Son Tay |
2,378 |
47.09 |
517 |
10.24 |
|
55 |
Minh Long |
1,825 |
38.62 |
539 |
11.41 |
|
56 |
Ba To |
5,005 |
32.91 |
2,024 |
13.31 |
|
57 |
Tay Tra |
2,824 |
62.45 |
817 |
18.07 |
|
|
Binh Dinh |
11,138 |
45.56 |
4,325 |
17.69 |
|
58 |
Van Canh |
3,305 |
42.56 |
1,631 |
21.00 |
|
59 |
Vinh Thanh |
3,815 |
43.40 |
1,328 |
15.11 |
|
60 |
An Lao |
4,018 |
50.93 |
1,366 |
17.31 |
|
|
Ninh Thuan |
2,419 |
38.10 |
1,140 |
17.96 |
|
61 |
Bac ai |
2,419 |
38.10 |
1,140 |
17.96 |
|
|
Kon Tum |
4,463 |
41.31 |
926 |
8.57 |
|
62 |
Kon Plong |
2,258 |
40.08 |
548 |
9.73 |
|
63 |
Tu Mơ Rong |
2,205 |
42.65 |
378 |
7.31 |
|
|
Lam Dong |
1,640 |
14.82 |
1,332 |
12.04 |
|
64 |
Dam Rong |
1,640 |
14.82 |
1,332 |
12.04 |
(Note: the rural district symbolized “*” are the new rural districts supplemented in accordance with Decision No.1791/QD-TTg dated October 01st, 2013 by the Prime Minister)
THE POOR HOUSEHOLD RATE IN 2013 OF 30 POOR RURAL DISTRICTS HAVE BEEN BENEFITED IN ACCORDANCE WITH RESOLUTION 30a/2008/NQ-CP OF THE GOVERNMENT
(Promulgated together with the Decision No.529/QD-BLDTBXH dated May 06th, 2014 by the Ministry of Labour - Invalids and Social Affairs)
|
STT |
Province/ City |
Poor household |
Near poor household |
||
|
Quality |
Rate (%) |
Quality |
Rate (%) |
||
|
|
Total |
141,260 |
34.48 |
56,400 |
13.77 |
|
07 poor rural districts prescribed as Decision No.615/QD-TTg dated April 25 th, 2011 by the Prime Minister |
|||||
|
|
Average 07 poor rural districts |
35,160 |
26.01 |
16,286 |
12.05 |
|
|
Thai Nguyen |
|
|
|
|
|
1 |
Vo Nhai |
4,659 |
28.30 |
2,137 |
12.98 |
|
|
Ha Tinh |
|
|
|
|
|
2 |
Huong Khe |
4,816 |
15.72 |
4,626 |
15.10 |
|
3 |
Vu Quang |
1,321 |
14.04 |
1,678 |
17.83 |
|
Quang Nam |
|
|
|
|
|
|
4 |
North Tra My |
5,170 |
52.78 |
924 |
9.43 |
|
|
Dak Nong |
|
|
|
|
|
5 |
Dak Glong |
5,711 |
49.32 |
1,152 |
9.95 |
|
|
Tien Giang |
|
|
|
|
|
6 |
Tan Phu Dong |
3,726 |
33.41 |
200 |
1.79 |
|
|
Tra Vinh |
|
|
|
|
|
7 |
Tra Cu |
9,757 |
21.15 |
5,569 |
12.07 |
|
23 poor rural districts prescribed as Decision No. 293/QD-TTg dated February 05th, 2013 by the Prime Minister |
|||||
|
|
Average 23 poor rural districts |
106,100 |
38.66 |
40,114 |
14.61 |
|
|
Cao Bang |
|
|
|
|
|
8 |
Thach An |
2,517 |
33.52 |
777 |
10.35 |
|
|
Tuyen Quang |
|
|
|
|
|
9 |
Lam Binh |
3,761 |
53.81 |
1,348 |
19.28 |
|
|
Lao Cai |
|
|
|
|
|
10 |
Van Ban |
5,053 |
28.40 |
2,970 |
16.69 |
|
11 |
Sa Pa |
3,494 |
31.57 |
936 |
8.46 |
|
12 |
Bat Xat |
4,422 |
28.21 |
1,767 |
11.27 |
|
|
Lang Son |
|
|
|
|
|
13 |
Binh Gia |
6,066 |
49.00 |
1,739 |
14.05 |
|
14 |
Dinh Lap |
2,667 |
40.88 |
954 |
14.62 |
|
|
Dien Bien |
|
|
|
|
|
15 |
Muong Cha |
4,113 |
53.50 |
738 |
9.60 |
|
16 |
Tuan Giao |
7,425 |
45.28 |
1,750 |
10.67 |
|
|
Hoa Binh |
|
|
|
|
|
17 |
Da Bac |
5,510 |
42.53 |
3,223 |
24.88 |
|
18 |
Kim Boi |
7,148 |
28.35 |
7,268 |
28.82 |
|
|
Nghe An |
|
|
|
|
|
19 |
Quy Chau |
6,228 |
45.02 |
2,373 |
17.15 |
|
|
Quang Nam |
|
|
|
|
|
20 |
Dong Giang |
2,512 |
42.11 |
510 |
8.55 |
|
21 |
Nam Giang |
3,572 |
62.68 |
339 |
5.95 |
|
|
Phu Yen |
|
|
|
|
|
22 |
Song Hinh |
4,834 |
41.87 |
2,007 |
17.38 |
|
23 |
Dong Xuan |
7,642 |
44.91 |
2,552 |
15.00 |
|
|
Kon Tum |
|
|
|
|
|
24 |
Dak Glei |
4,129 |
39.78 |
949 |
9.14 |
|
25 |
Sa Thay |
3,647 |
32.40 |
1,056 |
9.38 |
|
26 |
Kon Ray |
1,840 |
30.87 |
663 |
11.12 |
|
|
Gia Lai |
|
|
|
|
|
27 |
K Bang |
5,265 |
33.61 |
2,079 |
13.27 |
|
28 |
Kong Chro |
3,270 |
33.25 |
1,344 |
13.66 |
|
29 |
Krong Pa |
6,721 |
41.36 |
1,654 |
10.18 |
|
30 |
Ia Pa |
4,264 |
39.21 |
1,118 |
10.28 |